What election polls actually tell us about the 2020 presidential race
The 2020 presidential race is in its final stretch, but as President Donald Trump’s 2016 victory revealed, any prediction can still be turned upside down once the votes are counted.
After most surveys four years ago expected Hillary Clinton to emerge victorious, hindsight has registered some skepticism in political polls’ ability to forecast the winner. This year has turned out to be little different, with the race between Joe Biden and Donald Trump nail-bitingly close. With two presidential election results contradicting expectations, many are wondering how trustworthy are these measures in reality?
So two things:
— Dave Wasserman (@Redistrict) November 4, 2020
1) Biden is well on his way to flipping MI & WI (in addition to AZ & #NE02) and is doing well enough in PA's completed counties to be on track to win there
2) Polls (esp. at district-level) have rarely led us more astray & it's going to take a long time to unpack
Associate professor of political science Nathaniel Swigger discusses what goes into conducting polls and how to tell if one is reliable.
“There’s going to be a lot of variance from pollster to pollster, and in particular, you want to pay attention to the kinds of methodology they're using and especially how open they are about their methods,” Swigger said.

Nathaniel Swigger, associate professor of political science at Ohio State-Newark.
“Depending on the size of the sample and depending on the method that's being used by the pollster, you could have a margin of error that effectively makes any difference between the candidates meaningless,” Swigger said.
The size of the sample and where it’s coming from are key in helping determine the quality of the poll. Random digit dialing — doing live caller polls where everyone has an equal chance of being included — is considered the gold standard, Swigger said. But even that method has weaknesses.
“You can randomly select who you call, but you can't randomly select who actually does the poll,” Swigger said.
Not surprisingly, if you're getting it wrong in Pennsylvania, you're going to be getting it wrong in Wisconsin, you're going to be getting it wrong in Michigan and you're going to be getting it wrong in Ohio," Swigger said.
In general, research suggests that bumps and changes in candidate support as reported by polls have more to do with whose supporters are willing to actually do a poll, as opposed to changing opinions.
Plus, pollsters need to be mindful of social desirability bias — people being reluctant to give their real answer if they know it goes against what is considered acceptable.
“Even if you do everything right, even if you have good questions and good responses, you always worry about the systematic bias that might exist in your sample,” Swigger said.
That means if one particular demographic is underrepresented and that demographic tends to have particular political tendencies, then the results of a survey would be skewed. Those findings will be inaccurate unless the pollster adjusts them appropriately.
“You have to put your finger on the scale,” Swigger said. “For example, if you don't have enough young people, then the young people that you do have are going to be counted as 1.1 people or 1.5 people as opposed to just one person, and you hope that the young people that you do have are actually representative of young people in general.”
He says a lot of assumption goes into weighting data, and good pollsters will explain exactly what they have done.
However, the common struggle to survey young people hints at a much larger challenge for pollsters, especially those using random digit dialing. With cell phones and caller ID, the survey response rate has plummeted over the past 50 years.
“Landlines were incredibly common, people would answer their phones, and they'd also do surveys, so response rates at that time period, at least for academic pollsters, would run something like 50% to 60%.”
Now, a pollster is lucky to get a response rate of 3%. That difference is made up by much better statistics and technical power, but the reliance on weighting data, while necessary for presenting representative polls, introduces another opportunity for mistakes.
Pollsters need to understand which demographic factors are associated with political tendencies and how strong those tendencies are. Not having a complete picture of these trends is what led to the imperfect polling results in 2016.
“At the national level, polls were basically within the margin of error; most of the national polls got at least the national vote count more or less right,” Swigger said. “The polling error that existed really was a systematic error in the Midwest and Rust Belt states. Not surprisingly, if you're getting it wrong in Pennsylvania, you're going to be getting it wrong in Wisconsin, you're going to be getting it wrong in Michigan and you're going to be getting it wrong in Ohio.”

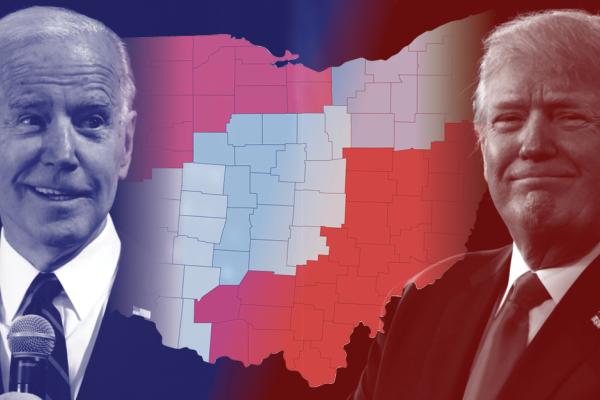
One poll by Your Voice Ohio and Bliss Institutue in August found Biden closing the gap in Ohio. He and Trump have been alternating leads in Ohio throughout the year. Illustration courtesy of Your Voice Ohio.
The shortfall tying all of those states together was that pollsters weren’t weighting by education. People without a college education are less likely to be captured in many polling samples, and “pollsters generally don't worry about that that much because people without a college education are usually less likely to vote,” Swigger said.
However, in 2016, white people without a college education voted at higher rates than before, and they voted overwhelmingly for Donald Trump.
“That’s basically what we missed,” Swigger said.
Now, most polls do weight by education to capture that dynamic missed four years ago. This time around, that definitely won’t be the problem, but he said it’s possible a new unpredictable issue will arise.
We've learned things. Most polls now actually will weight by education and specifically try to capture that dynamic that was missed in 2016," Swigger said. "So there might be something wrong with the polls this year, but it definitely won't be the same thing that was wrong with the polls in 2016. If there's something that we're missing now it's going to be a completely new."
Despite the challenges in conducting an accurate poll, Swigger says they can still provide useful information. He, personally, likes FiveThirtyEight’s polling aggregation because it makes spotting an outlier easier.
“There are so many polls being conducted right now that even if you assume that everybody's acting in good faith and has a good methodology, there's enormous potential to produce an outlier — something that's just wrong by chance,” he said. “I like polling aggregation sites because you can see when the polls tend to be converging and when everybody's kind of in agreement.”
The key to being an informed, critical poll consumer, Swigger says, is to always read beyond the headline. Ask how the poll is being conducted, who is conducting it and don’t get carried away by one polling result.
“If you ever see the headline that reads ‘Shocking new poll finds!’ then in your mind just immediately go, ‘OK, I know what outliers are, and this is probably just an outlier,’” Swigger said. “The person who finds the shocking new result probably just happened to be the person who got the bad sample.”